
Development and Validation of a New Design Selfassessment logMAR Visual Acuity Test (“Chudjane” iPhone- and iPad-based Application) in a Normal Eyes Population
DOI:
https://doi.org/10.33192/Smj.2022.70Keywords:
Self-assessment, visual acuity, mobile applicationAbstract
Objective: To validate and further design the “Chudjane” application (app), a new design self- assessment logMAR test for distance visual acuity (VA), by comparing the results against the use of a standard numeric ETDRS chart in normal eye population.
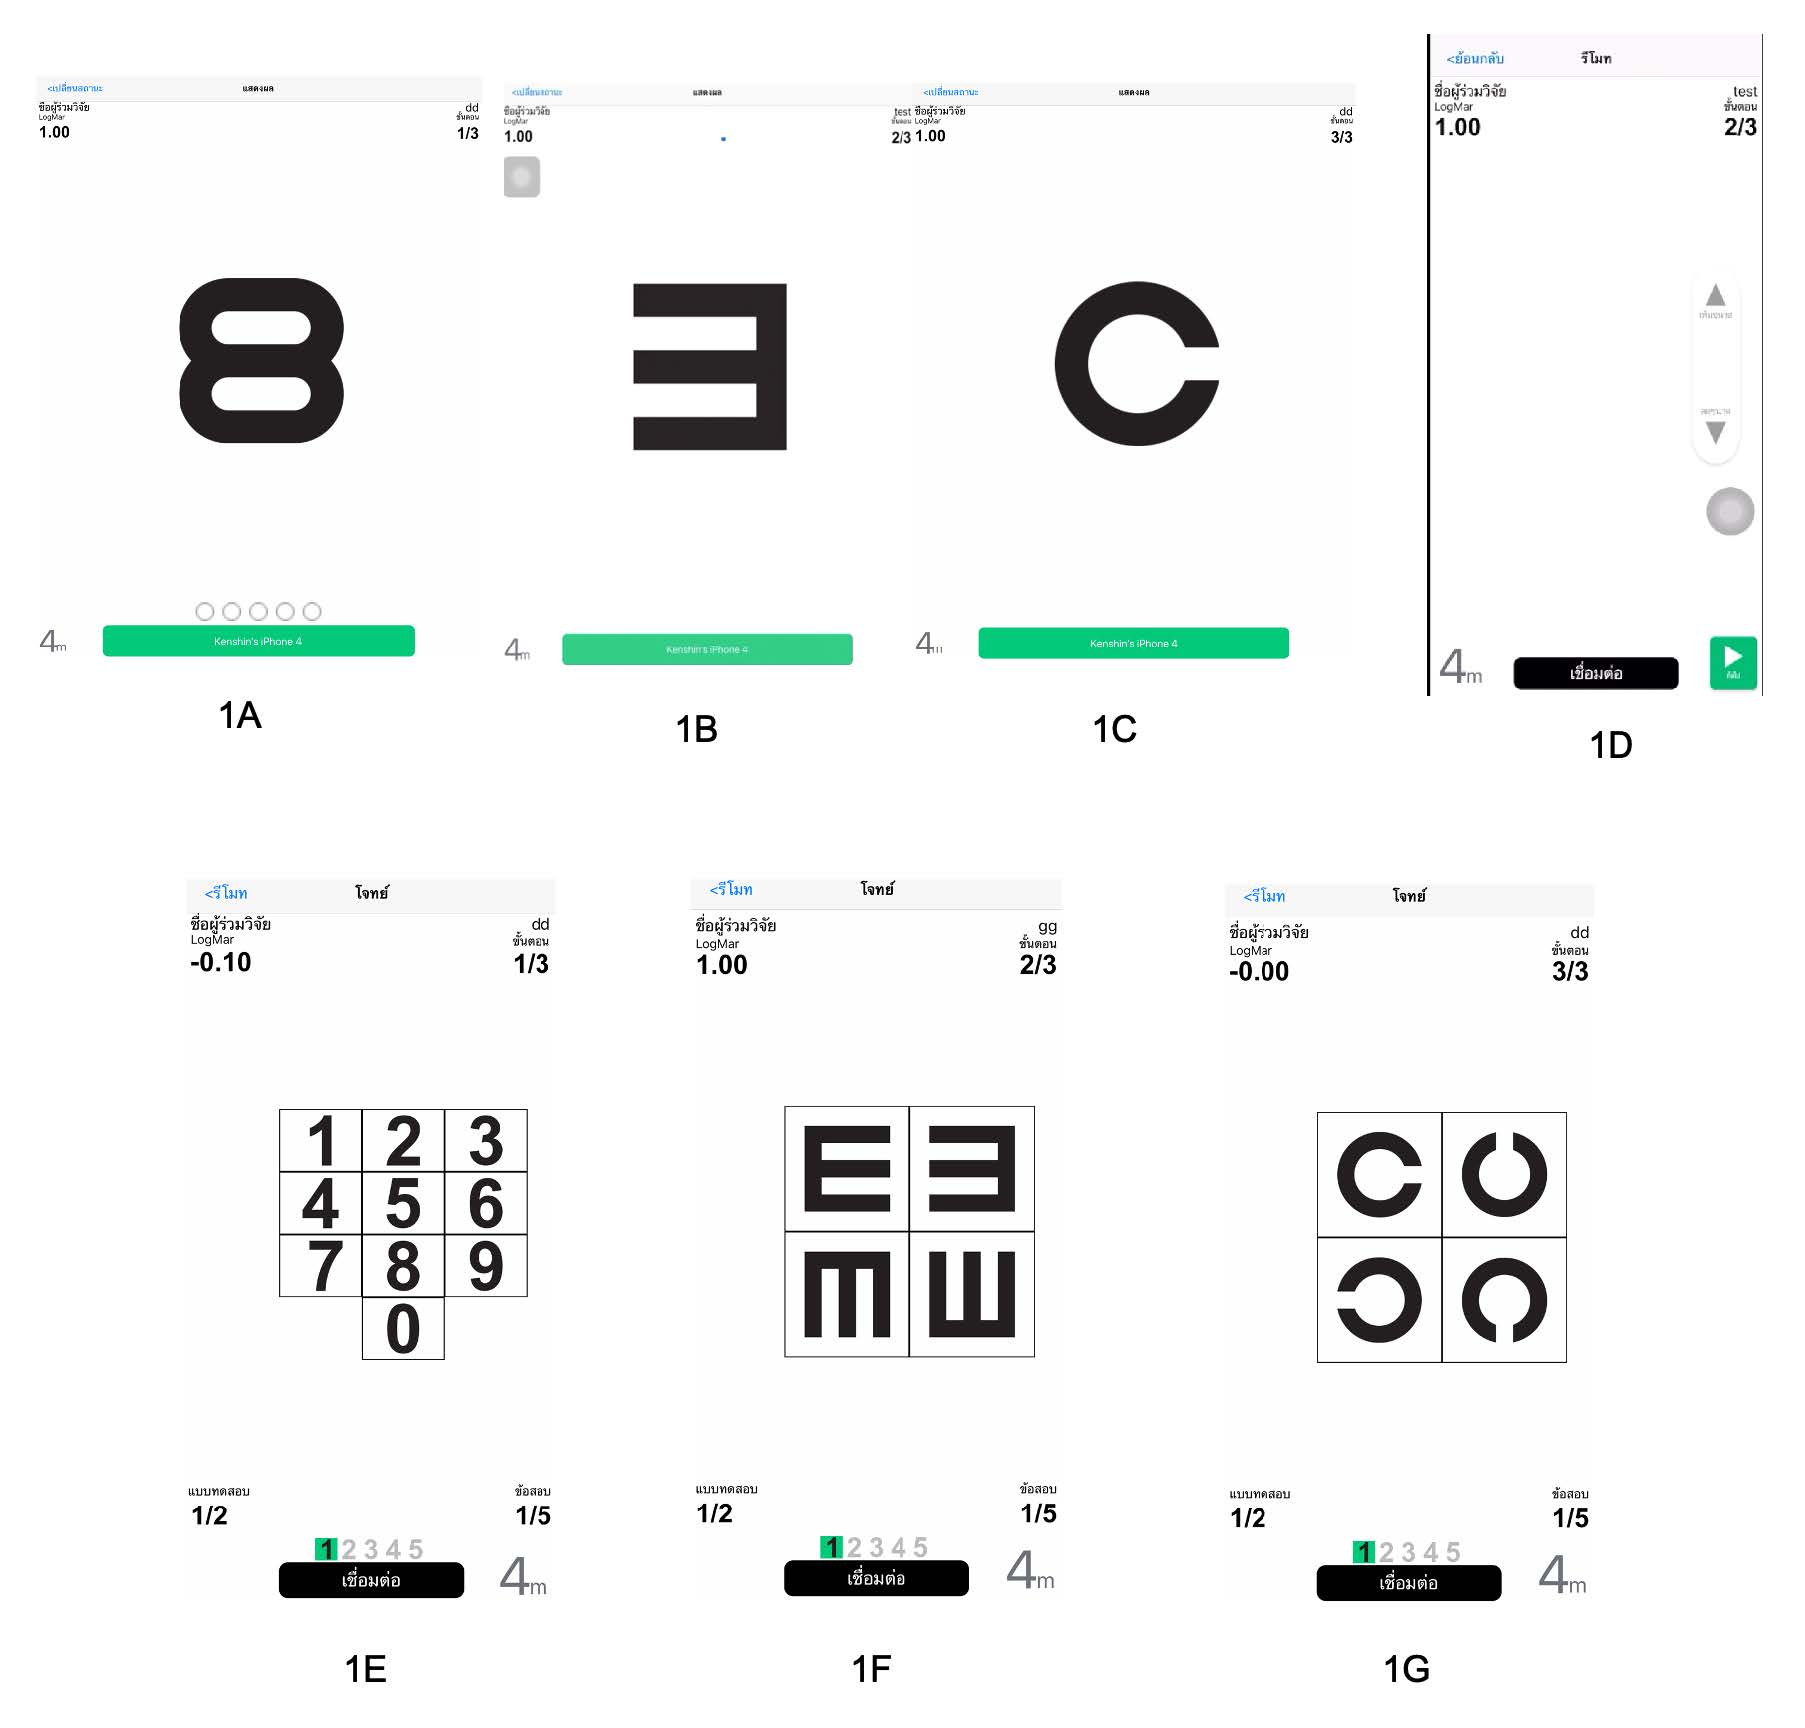
Materials and Methods: In total, 52 volunteers who had a normal eye exam and best-corrected VA score by numeric ETDRS (NE) chart equal to or better than 6/6 (logMAR score 0.00 or less) were included. The “Chudjane” app with 3 patterns of optotypes (Arabic numbers (AN), Tumbling-E (TE) and Landolt-C (LC)) was used twice to assess VA individually.
Results: The mean VA in each test NE, AN, TE, LC from the first round were -0.06, -0.10, -0.08 and -0.04, respectively compared to -0.07, -0.12, -0.09 and -0.05 from the second round respectively. Comparing results from the first and second round revealed that NE and LC had higher test-retest reliability (ICC=0.712, 0.789 respectively) than AN and TE (ICC=0.140, 0.495 respectively). For validity, result from NE was compared to each app test using the second round values. Modified Bland-Altman plot showed the mean differences (95% LOA) for NE-AN, NE-TE and NE-LC of 0.05 (-0.11 to 0.20), 0.02 (-0.11 to 0.15) and -0.03 (-0.19 to 0.13) respectively. Simple linear regression analysis of the difference (i.e. NE-AN, NE-TE and NE-LC) on NE showed that the difference did not depend on the NE value with slope close to zero.
Conclusion: The study demonstrated that by using the «Chudjane» application, LC had higher test-retest reliability and higher validity than TE and AN compared to the standard ETDRS chart.
References
Bastawrous A, Rono H, Livingstone IA, Weiss HA, Jordan S, Kuper H, et al. The Development and Validation of a Smartphone Visual Acuity Test (Peek Acuity) for Clinical Practice and Community-Based Fieldwork. JAMA Ophthalmol. 2015;133(8):930-7.
Reich LN, Ekabutr M. The effects of optical defocus on the legibility of the Tumbling-E and Landolt-C. Optom Vis Sci. 2002;79(6):389-93.
Alexander KR, McAnany JJ. Determinants of Contrast Sensitivity for the Tumbling E and Landolt C. Optom Vis Sci. 2010;87(1):28-36.
Guimaraes S, Fernandes T, Costa P, Silva E. Should tumbling E go out of date in amblyopia screening? Evidence from a population-based sample normative in children aged 3–4 years. Br J Ophthalmol. 2018;102(6):761-6.
Laidlaw DAH, Abbott A, Rosser DA. Development of a clinically feasible logMAR alternative to the Snellen chart: performance of the "compact reduced logMAR" visual acuity chart in amblyopic children. Br J Ophthalmol. 2003;87(10):1232-4.
Kaiser PK. Prospective Evaluation of Visual Acuity Assessment: A Comparison of Snellen Versus ETDRS Charts in Clinical Practice (An AOS Thesis). Trans Am Ophthalmol Soc. 2009;107:311-24.
Bailey IL, Lovie-Kitchin JE. Visual acuity testing. From the laboratory to the clinic. Vision Res. 2013;90:2-9.
Economic Statistics Division, National Statistical Office, Ministry of Digital Economy and Society. The 2018 household survey on the use of information and communication technology (Quarter 1). The characteristics of population using information and communication technology. [Internet]. 2018 [cited 2019 June 10] :52. Available from: http://www.nso.go.th/sites/2014/DocLib13/ด้านICT/เทคโนโลยีในครัวเรือน/2561/ict61-CompleteReport-Q1.pdf
Brady CJ, Eghrari AO, Labrique AB. Smartphone-Based Visual Acuity Measurement for Screening and Clinical Assessment. JAMA. 2015;314(24):2682-2683.
Perera C, Chakrabarti R, Islam FMA, Crowston J. The Eye Phone Study: reliability and accuracy of assessing Snellen visual acuity using smartphone technology. Eye. 2015;29:888.
Zvornicanin E, Zvornicanin J, Hadziefendic B. The Use of Smartphones in Ophthalmology. Acta Informatica Medica. 2014; 22(3):206-9.
Ventola CL. Mobile devices and apps for health care professionals: uses and benefits. P T. 2014;39(5):356-64.
Kuo H-K, Kuo M-T, Tiong I-S, Wu P-C, Chen Y-J, Chen C-H. Visual acuity as measured with Landolt C chart and Early Treatment of Diabetic Retinopathy Study (ETDRS) chart. Graefe Arch Clin Exp Ophthalmol. 2011;249(4):60:1-5.
Rhiu S, Lee HJ, Goo YS, Cho K, Kim J-H. Visual Acuity Testing Using a Random Method Visual Acuity Application. Telemed J E Health. 2016;22(3):232-7.
Han X, Scheetz J, Keel S, Liao C, Liu C, Jiang Y, et al. Development and Validation of a Smartphone-Based Visual Acuity Test (Vision at Home). Transl Vis Sci Technol. 2019;8(4):27.
McMonnies CW. Chart memory and visual acuity measurement. Clin Exp Optom 2001;84:26-33.
Published
How to Cite
Issue
Section
License

This work is licensed under a Creative Commons Attribution-NonCommercial-NoDerivatives 4.0 International License.
Authors who publish with this journal agree to the following conditions:
Copyright Transfer
In submitting a manuscript, the authors acknowledge that the work will become the copyrighted property of Siriraj Medical Journal upon publication.
License
Articles are licensed under a Creative Commons Attribution-NonCommercial-NoDerivatives 4.0 International License (CC BY-NC-ND 4.0). This license allows for the sharing of the work for non-commercial purposes with proper attribution to the authors and the journal. However, it does not permit modifications or the creation of derivative works.
Sharing and Access
Authors are encouraged to share their article on their personal or institutional websites and through other non-commercial platforms. Doing so can increase readership and citations.